
Maps of America
Project Overview
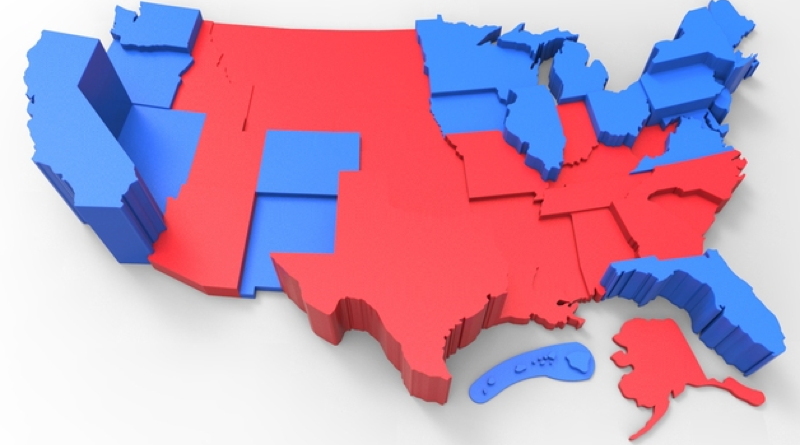
We plan to have 3D printed maps that school teachers, mainly middle school and high school teacher, to use to help their students understand the electoral college in the presidential elections. More specifically we will look at the 2000 presidential election between George W. Bush and Al Gore. In this case Al Gore won the popular vote but did not win the electoral college vote, which ultimately led to George W. Bush winning the election and becoming the next president. This map’s relevance is to show a better representation of what the electoral map actually looks like and instead of just a number in the state that can often be misleading.
A second project idea we have is an idea of creating a population density map. This will be a more in-depth model than the electoral vote map of the United States which will show the densely populated areas and cities around the United States. Some people have already came up with different maps and ways to show the electoral college but we believe that we can make a better model showing the size of the state compared to the number of electoral votes. With the population density some people have made a 3D model with the one area sticking up instead of making a smooth map like we plan to do.
Pingback:Getting on the Campaign Trail… – Representing the World in 3D