
Running Closer and Closer to Election Time
Weekly Update
For this week we finalized the setting in TinkerCAD for the Trump vs. Clinton election to get the print that we were looking for, we were finally able to include Alaska and Hawaii in the final print as well. We also came up with a Project Timeline and Project Pitch for the remainder of the semester, loacated towardds the bottom of the page.

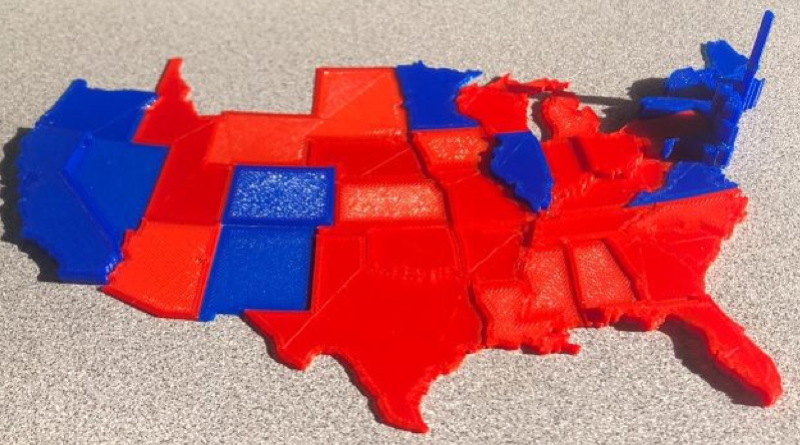
We started test printing our volume maps as well. We made a total of two prints. The first print was not at all what we were looking for and very little differences between the states could be seen. This map was not sturdy at all and some of the states were to thin to be be able to transport anywhere. In the picture below you can see that Montana did not print and that is because it was too thin to stay together when it came off the printer.
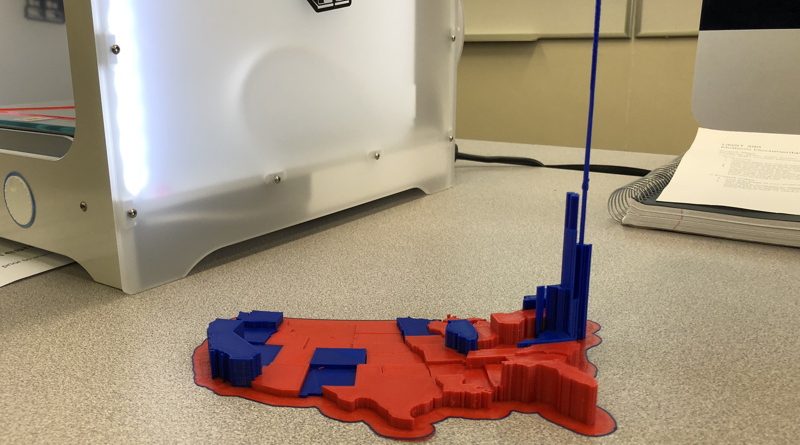
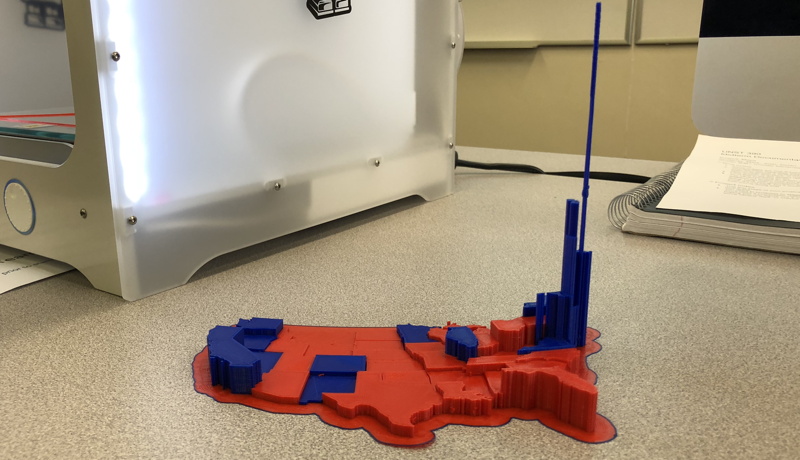
For the second print we made the values five times larger than the original so that we could avoid the problems that the we encountered in the first print. This map came out a lot better and a lot more stable. We also decided to keep the skirt that is optional in Ultimaker Cura, the software used to get prints ready to send to the printer.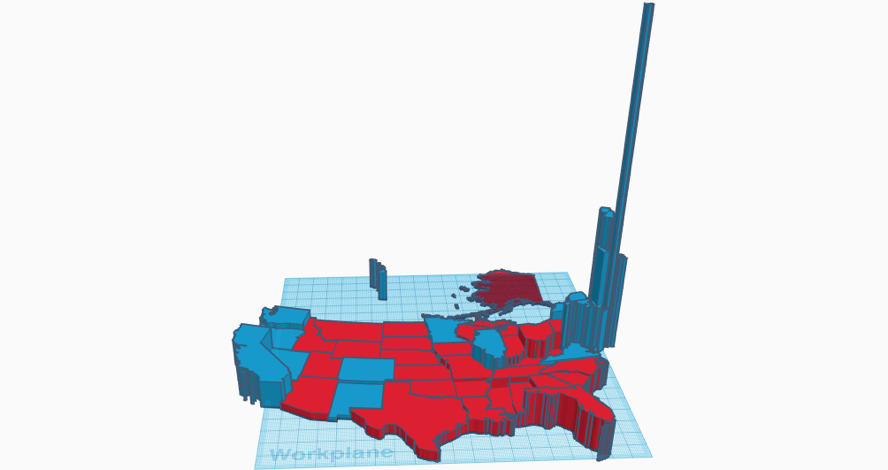
The image above is our TinkerCAD product before we exported it to Ultimaker Cura to begin the print process. This print can be found on Austin’s TinkerCAD account. We continued to use the state shapes from the Community Featured Shape Generator.
Project Timeline
- Finish printing the electoral college map
- Try to add labels on states with the electoral college votes by state
- Create and print the volume map of the election
- Once we have created the volume and height electoral college map, compare the two with a close election such as the Bush Gore election
- Other potential projects that have to do with hot topics:
- Immigration Map
- Childhood Obesity map
- Other ideas to come as seen fit
- Finding professors to talk to about our project and getting input from them.
Dates are tentative right now but with the end of the semester coming the extra projects will be up in air as we try to figure out our final presentation setup.
Presentation Pitch
Show students different models we have created for the elections that have the representation of the electoral college and then some other 3D prints such as immigration differences in states and show them how with 3D technology can help students get a better grasp on what they learn. Many people are visual learners and looking at a PowerPoint with a bunch of numbers and and other information does not do much to help the student learn. Why not a have hands-on model that the student can look at and get a better idea of what is going on. There will also be a great opportunity for them to formulate questions based on the model that they are given. We ultimately hope to have people understand that 3D technology creates the visual tool to help student better grasp concepts that are taught.
***Feature Image by: The Wall Street Journal***