

Wed 1/17 – First Thoughts
Points for your work
Sign-up sheet with “witnesses” to record if you have (1) your Tinkercad designs and (2) your printed thoughts on the videos from last time.
First Tinkercad prints
3D printing takes time, so we’ll get your Tinkercad designs to the printers as soon as possible:
- Log into Tinkercad
- Download as STL
- Print on Ultimakers:
- Open Cura software and import file
- Walk through slicer settings with me
- Export to USB or SD card and print on Ultimakers
- Print on Afinias:
- Open 3D Afinia software and import file
- Initialize printer and walk through settings with me
- Print on Afinias
Discuss videos and try out pitches
Which videos did you find the most interesting and why? Discuss in groups and as a class. Start making very preliminary pitches for projects. Our ultimate goal is to divide into four groups, each with a different project, so make your case to the class.
“Truthiness” of charts and graphs
Starting from the featured image and moving on to the ones below, let’s discuss what features of graphs are good and what features can be misleading…
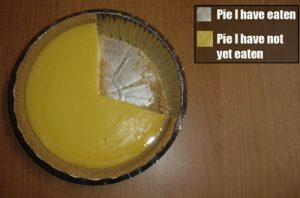
Image from Edward Tufte
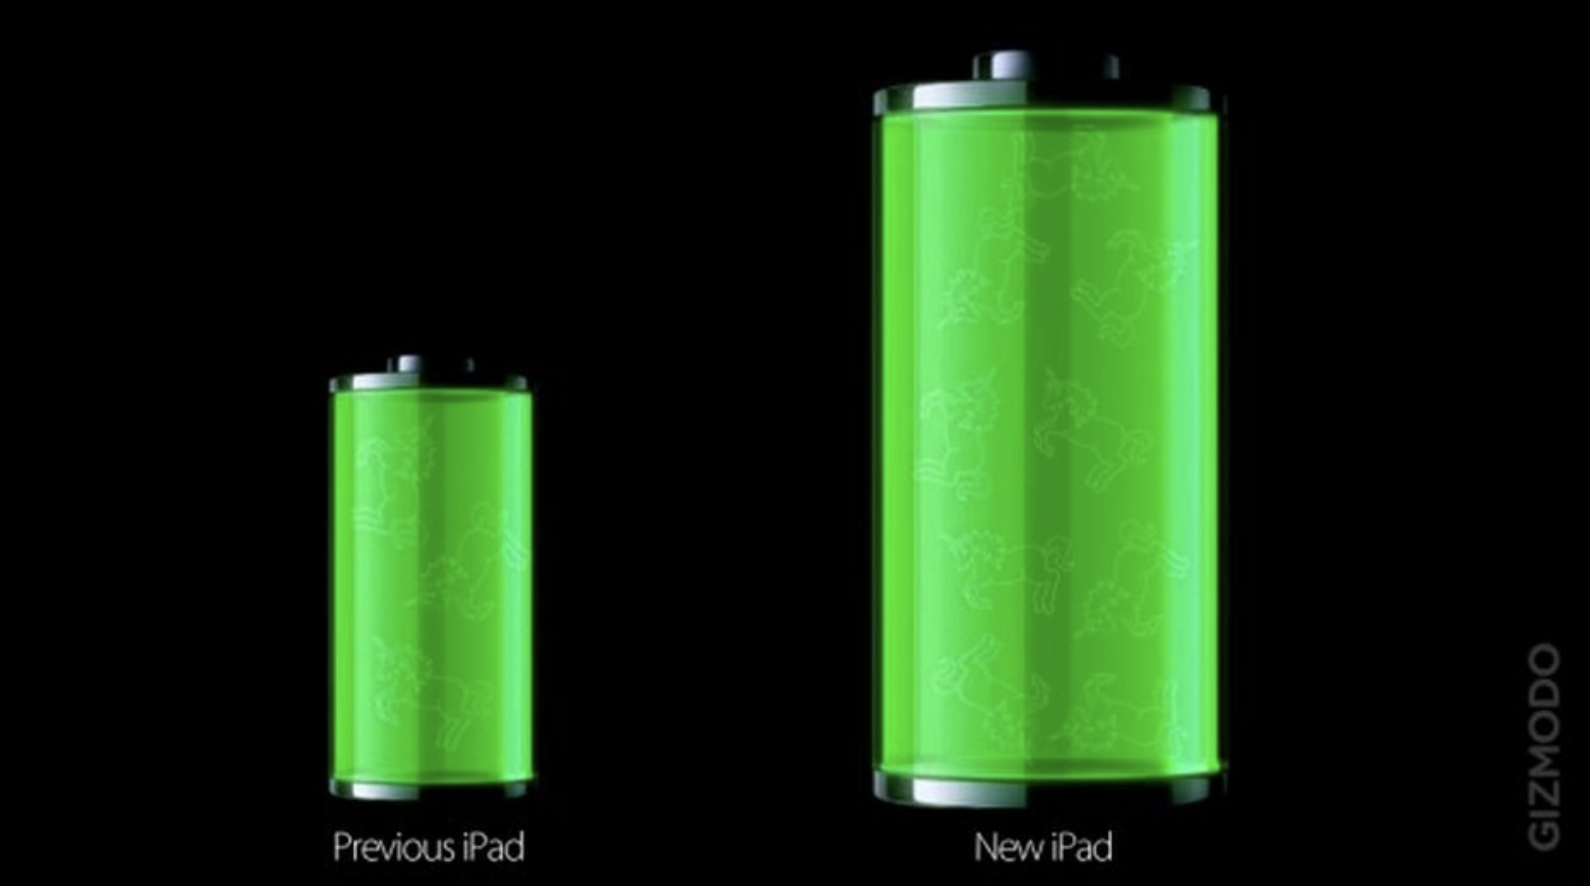
Image from The 27 Worst Graphs of All Time
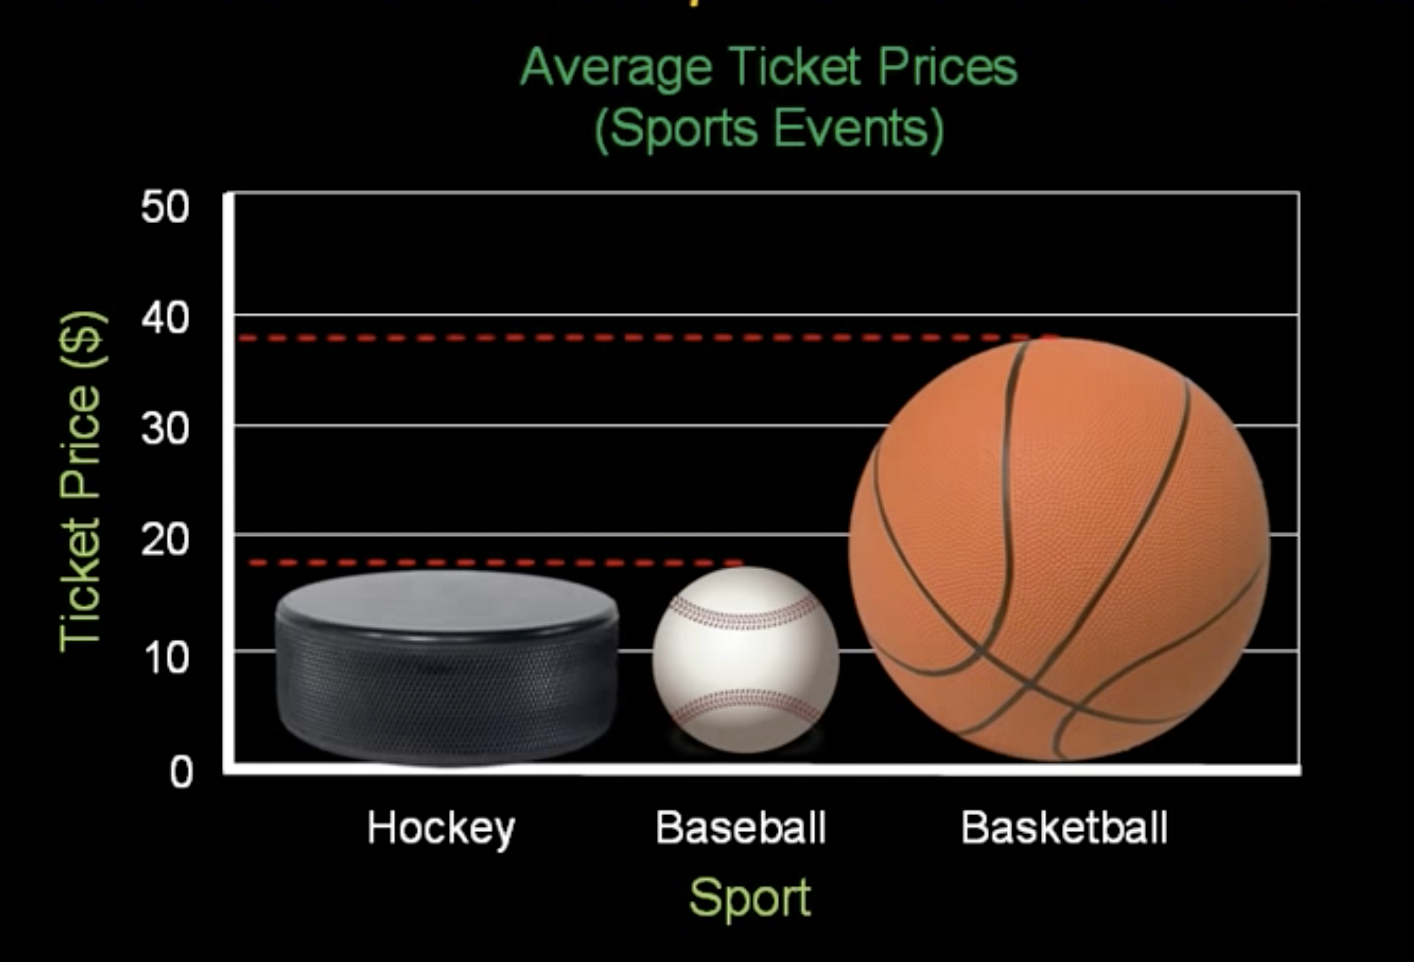 Image from Konst Math
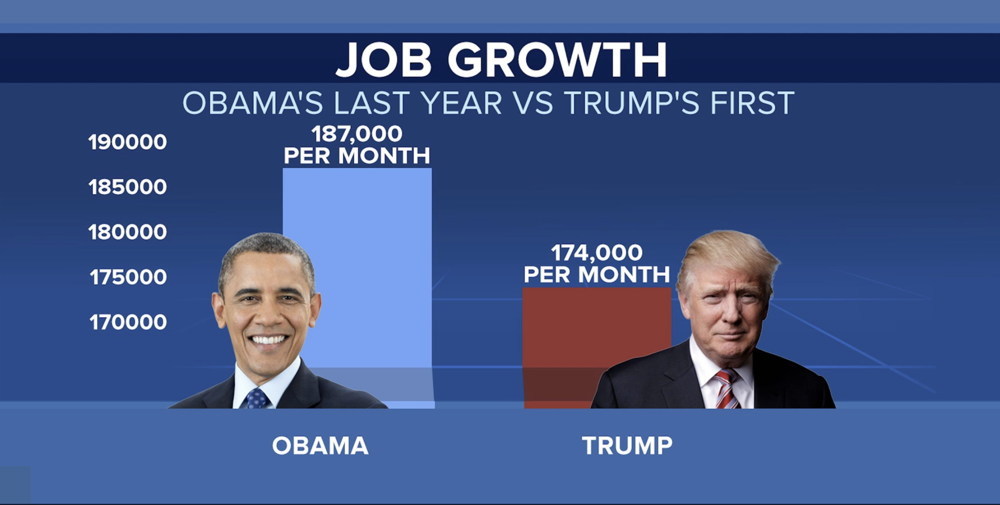 Image from Ari Melber’s Twitter
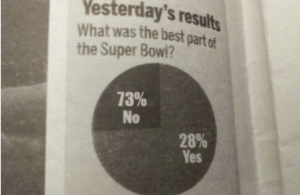
Image from The 27 Worst Graphs of All Time
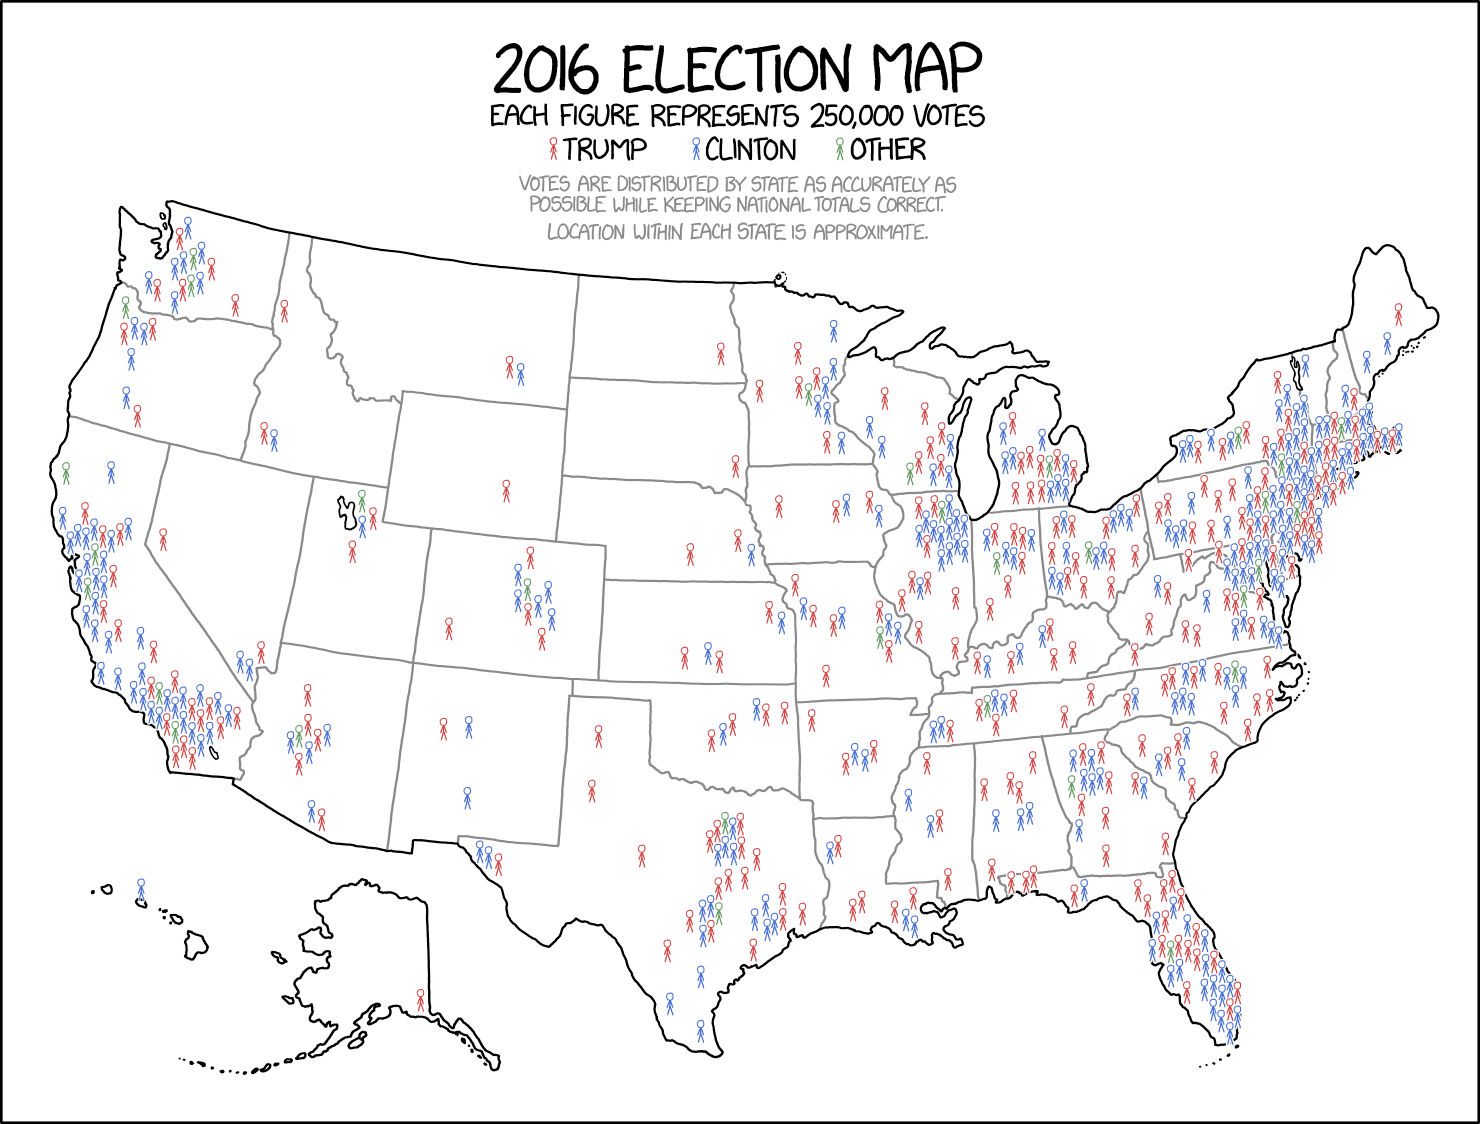
now, a good one!
For next time
Make a typed project pitch and bring it with you to Monday’s class. You’ll have to do some research. See the Assignments page for details.
// Cover image from iStock